There are many ways to extract analytics data from Google Search Console (GSC).
While I mostly like to extract data in bulk using the native BigQuery connector, Looker Studio or the GSC API, there are times when the GSC dashboard is good enough.
The ‘Export’ option in the GSC dashboard lets you download your data as a Google Sheet, Excel or CSV file.
But one of my biggest bugbears is the difference between the dashboard output and the ‘Export’ output when comparing date ranges.
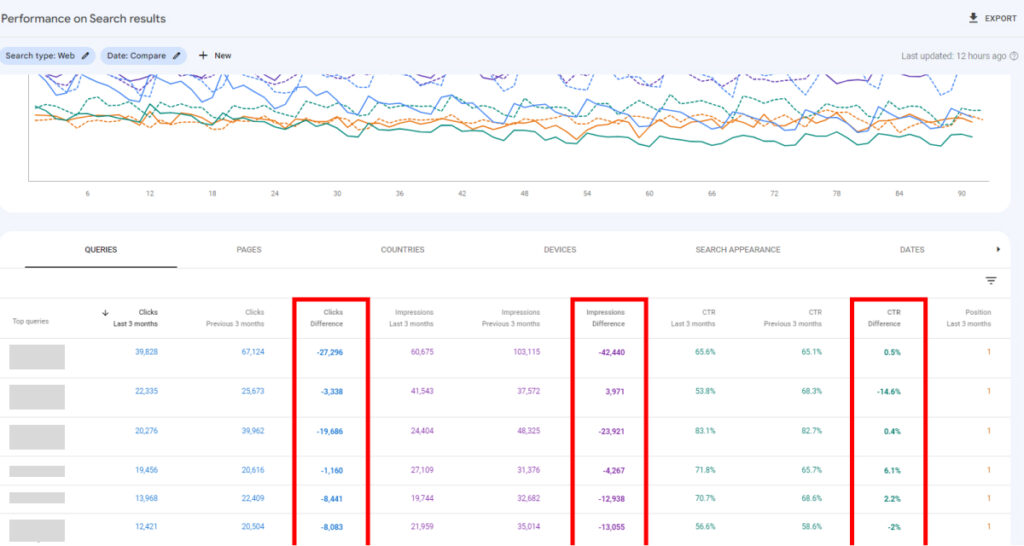
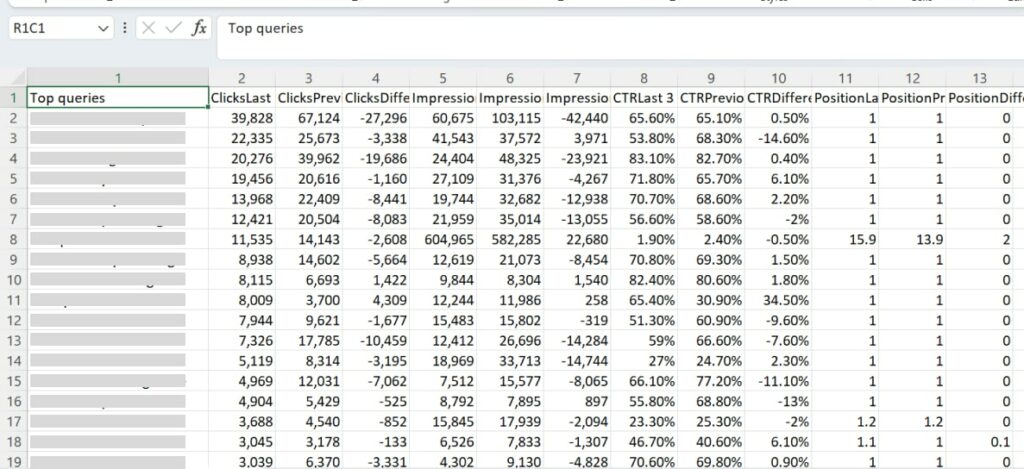
When comparing date ranges in GSC analytics, you can see dedicated columns in the dashboard for ‘Clicks Difference’, ‘Impressions Difference’, ‘CTR Difference’ and ‘Position difference’.
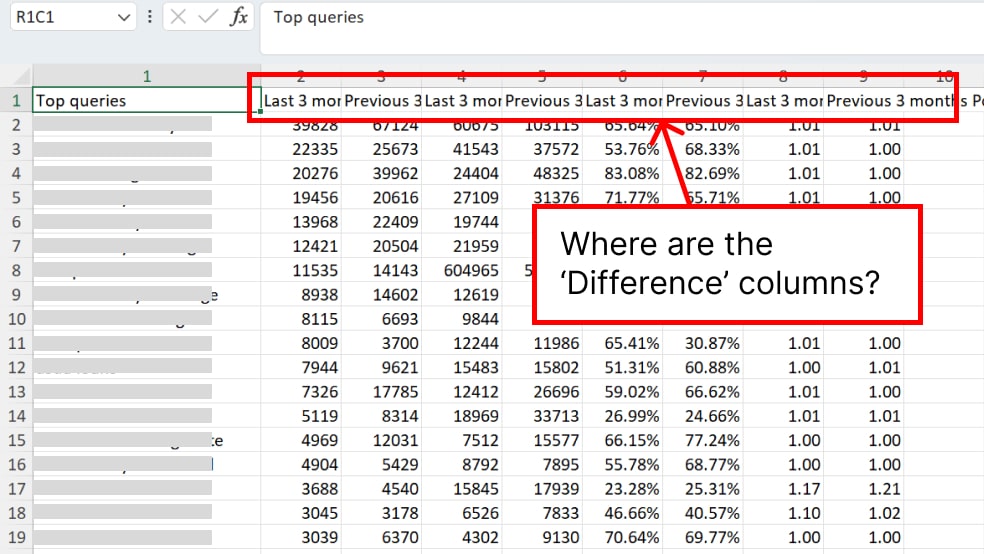
Yet, when you export the data, the ‘Difference’ metrics columns are unavailable.
Why GSC doesn’t export the ‘Difference’ metrics columns is still a mystery to me. Recently, I’ve decided that enough is enough and built a script to pull this data directly from the GSC dashboard without the official export function.
In the guide below, I’ll share the script and explain the simple steps you must follow to extract the data directly.
We’ll use the Chrome DevTools Console to interact with the DOM and extract the table as a downloadable CSV file.
Step 1:
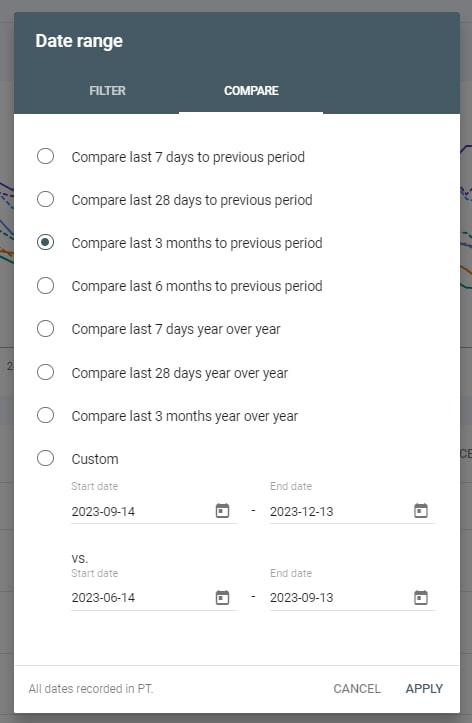
Set up your Google Search Console analytics dashboard with your preferred comparison date ranges and preferred metrics to export.
Step 2:
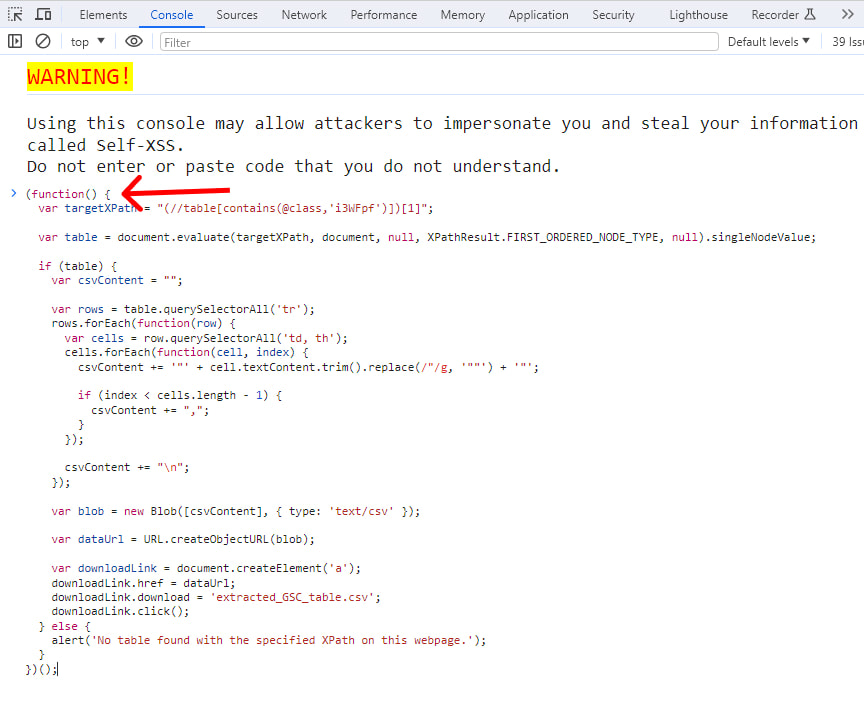
Copy this JavaScript code:
(function() {
  var targetXPath = "(//table[contains(@class,'i3WFpf')])[1]";

  var table = document.evaluate(targetXPath, document, null, XPathResult.FIRST_ORDERED_NODE_TYPE, null).singleNodeValue;

  if (table) {
    var csvContent = "";

    var rows = table.querySelectorAll('tr');
    rows.forEach(function(row) {
      var cells = row.querySelectorAll('td, th');
      cells.forEach(function(cell, index) {
        csvContent += '"' + cell.textContent.trim().replace(/"/g, '""') + '"';

        if (index < cells.length - 1) {
          csvContent += ",";
        }
      });

      csvContent += "\n";
    });

    var blob = new Blob([csvContent], { type: 'text/csv' });

    var dataUrl = URL.createObjectURL(blob);

    var downloadLink = document.createElement('a');
    downloadLink.href = dataUrl;
    downloadLink.download = 'extracted_GSC_table.csv';
    downloadLink.click();
  } else {
    alert('No table found with the specified XPath on this webpage.');
  }
})();
You can edit the file name by changing the ‘extracted_GSC_table.csv’ name in the code.
Step 3:
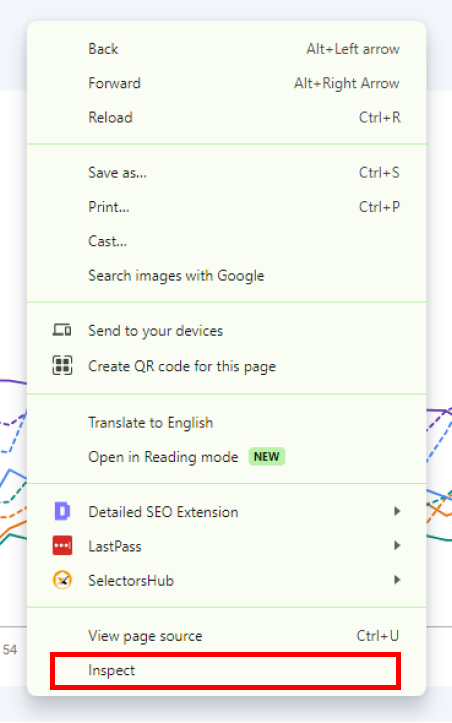
Go back to your GSC dashboard and right-click anywhere on the page. Now, select ‘Inspect’ from the dropdown menu.
Step 4:
Navigate to the DevTools Console tab and paste the code into the Console prompt.
Step 5:
The CSV will automatically download into your local Downloads folder, where you can see ALL the comparison data in a single table.
Please note:
- The table uses the Xpath targeting of //table[contains(@class,’ i3WFpf’)])[1] – in other words, it targets the first instance of a table with the class name of “i3WFpf”. If our friendly Googlers decide to change the class name, the Xpath must be adjusted accordingly.
- If you run the script more than once on different GSC accounts, you’ll find that it may extract the previous account’s data. It has to do with the SPA-based data fetching and rendering. In such an instance, refresh the page, and the table should extract correctly.
- This script can also extract a singular date range, such as the last 6 months. It doesn’t have to be in ‘Compare’ date range mode to work.