If you’re a heavy user of Google Search Console (GSC) for SEO , you’ll find the native bulk data export for BigQuery to be a game-changer. I encourage you to try it if you haven’t tried it yet.
Since its release by the Google team in February 2023, this native export feature for BigQuery not only makes it incredibly easy to retrieve more organic search data for your website but also allows you to query the data in ways that are impossible with the standard Google Search Console dashboard.
In this article, I’ll discuss some of the main advantages of analyzing the data with BigQuery, and show a combination of basic and more advanced example SQL queries to get you started.
Set up the BigQuery connection
To get started, you must set up a BigQuery account and connect it to your Google Search Console dashboard. Google provides simple setup instructions in their documentation that you can follow.
Keep in mind that BigQuery is a pay-as-you-go service provided by Google. You pay for the amount of data you store and process. However, the free plan provides up to 10 GB of active storage and up to 1 TB processing allowance before you start paying for usage. So unless you store and compute crazy amounts of data, you’ll be fine, and the free plan should suffice.
Advantages of the bulk data export for BigQuery
Google Search Console’s bulk data export for BigQuery helps us bypass 2 significant restrictions in the standard dashboard.
Data sampling
First, data found in the Google Search Console dashboard is sampled. In other words, Google only shows you a small size of the available data as a “sample” of a larger dataset. The sampling issue isn’t bad for small websites with little organic traffic. But, larger websites that generate significant traffic from Google organic search would find the sampling issue a hindrance.
Anyone previously using Google Search Console would know that data available in the standard dashboard is limited to 1000 sample pages or queries. In a recent ‘Intro to Google APIs‘ video for Google Search Console Training, Daniel Waisberg (Search Advocate Google) highlighted that API and Looker Studio Connectors will provide up to 50000 samples.
Having larger datasets is highly advantageous for larger websites or companies looking to use this data for modelling, strategy or more accurate reporting.
Better segmentation and filtering
The standard Google Search Console dashboard limits you to a single filter per dimension. The filtering limitations in GSC have always been a bugbear of mine. For example, I can filter my query or page data to only show me results from the United Kingdom. But I can’t filter my query or page data by United Kingdom AND United States.
In BigQuery, however, you can multilayer filters whichever way you want. You’re not facing the limitation of the Google Search Console dashboard. As shown below, you can also use more advanced SQL filtering, such as CASE WHEN or nested table queries, to drill down or segment your data.
Lightning-fast performance
Another key advantage of BigQuery is that it’s a lightning-fast analytics database. It’s not necessarily an issue per se with the Google Search Console dashboard, but still important to know if you’re dealing with large datasets. In a 2016 article, it is shown how BigQuery can analyze the Wiki100B table, which contains 100 billion rows and is about 7 Terabytes in size, in just under 30 seconds! That’s impressive.
Trying to run this type of table in Excel is impossible. Excel will stall and die on you while attempting to open the document. Never mind trying to process anything!
Example SQL queries for BigQuery
Before we jump in, it’s worthwhile pointing out that Google provides us with a handful of sample queries to get started.
Additionally, Trevor Fox provides an excellent overview of the GSC and BigQuery setup, estimated costs, data dictionaries, and more.
Finally, before we start, it’s also important to mention that my website gets very little traffic from Google organic search. It makes this demonstration exercise tricky, but that’s all I have, so we need to go with it!
With that said, let’s get started with a straightforward SQL query:
Basic SQL query
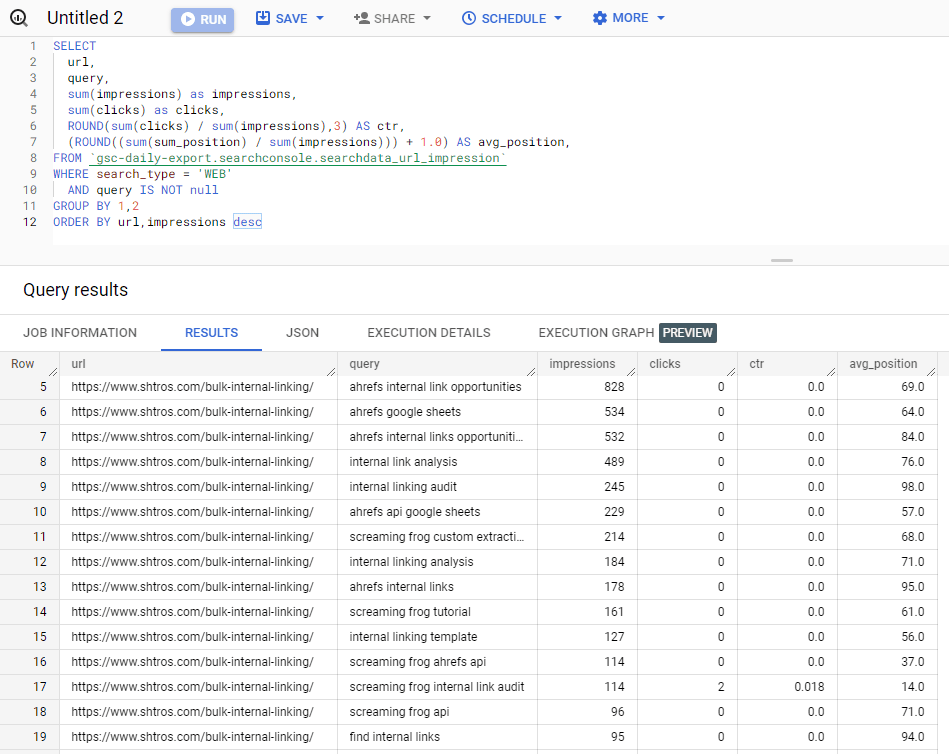
Let’s say I want to view a table that shows the URL, query (keyword), clicks, impressions, CTR and average position. In many respects, it’s similar to what I would see in Google Search Console. However, in this table, we can see the URL and query data together. That’s incredibly useful! We can even sort our results by URL and clicks, meaning that query data will show from most to least clicks while also being grouped by URL.
In the screenshot below, I used a URL and impressions filter instead because my website hardly generates clicks from Google! The results would look untidy and depressing to look at.
And here is the code for you to copy/paste:
SELECT
  url,
  query,
  sum(impressions) as impressions,
  sum(clicks) as clicks,
  ROUND(sum(clicks) / sum(impressions),3) AS ctr,
  (ROUND((sum(sum_position) / sum(impressions))) + 1.0) AS avg_position,
FROM `gsc-bulk-data-export.searchconsole.searchdata_url_impression`
WHERE search_type = 'WEB'
  AND query IS NOT null
GROUP BY url,query
ORDER BY url,clicks desc
Branded vs non-branded search queries
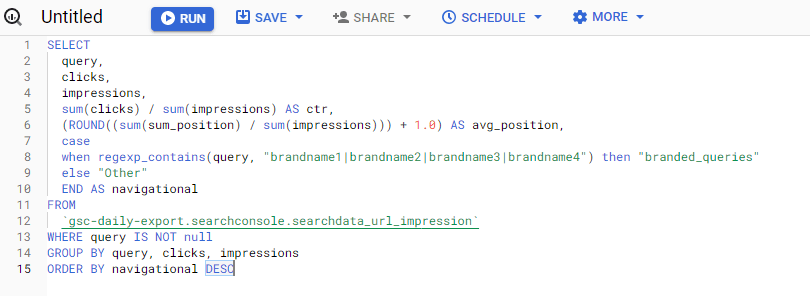
One of the most used search filters in Google Search Console is the branded vs non-branded search results. With BigQuery, we can find this type of information but on a much bigger scale. For the query below, we will add an additional column to our table that tells us whether the query is “branded” or “other”, alongside the usual clicks, impressions, CTR and average position.
Don’t forget to change the “brandname” found in the CASE WHEN statement to your website’s brand name variants.
You can copy/paste the code here:
SELECT
  query,
  clicks,
  impressions,
  sum(clicks) / sum(impressions) AS ctr,
  (ROUND((sum(sum_position) / sum(impressions))) + 1.0) AS avg_position,
  case
  when regexp_contains(query, "brandname1|brandname2|brandname3|brandname4") then "branded_queries"
  else "Other"
  END AS navigational
FROM
  `gsc-daily-export.searchconsole.searchdata_url_impression`
WHERE query IS NOT null
GROUP BY query, clicks, impressions
ORDER BY navigational DESC
Branded vs non-branded total queries
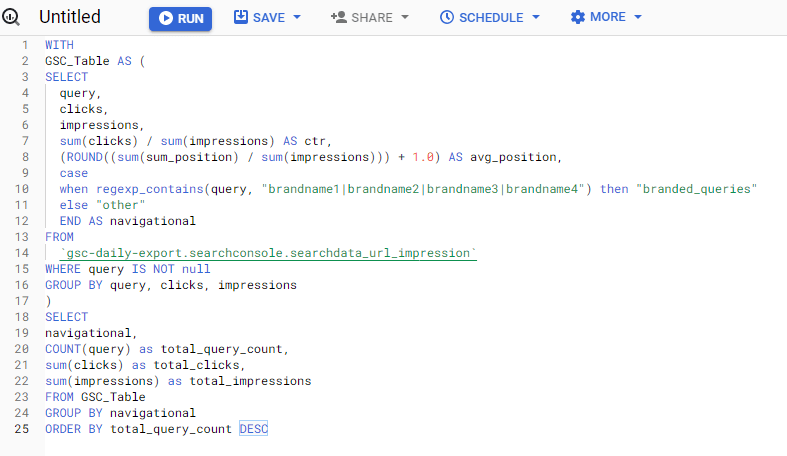
Let’s take the “branded” vs “other” data from our last query and nest it in another table to get a high-level view of how many queries, clicks and impressions does each category receive from Google.
You can copy/paste the code here:
WITH
GSC_Table AS (
SELECT
query,
clicks,
impressions,
sum(clicks) / sum(impressions) AS ctr,
(ROUND((sum(sum_position) / sum(impressions))) + 1.0) AS avg_position,
case
when regexp_contains(query, "brandname1|brandname2|brandname3|brandname4") then "branded_queries"
else "other"
END AS navigational
FROM
`gsc-daily-export.searchconsole.searchdata_url_impression`
WHERE query IS NOT null
GROUP BY query, clicks, impressions
)
SELECT
navigational,
COUNT(query) as total_query_count,
sum(clicks) as total_clicks,
sum(impressions) as total_impressions
FROM GSC_Table
GROUP BY navigational
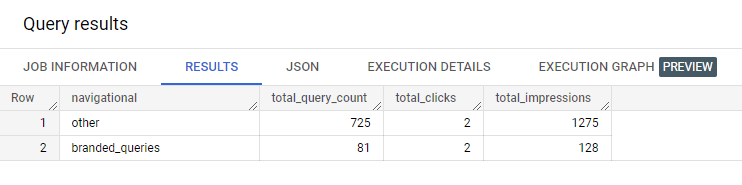
ORDER BY total_query_count DESCThe results show us the following data:
Add a subdirectory column to your table
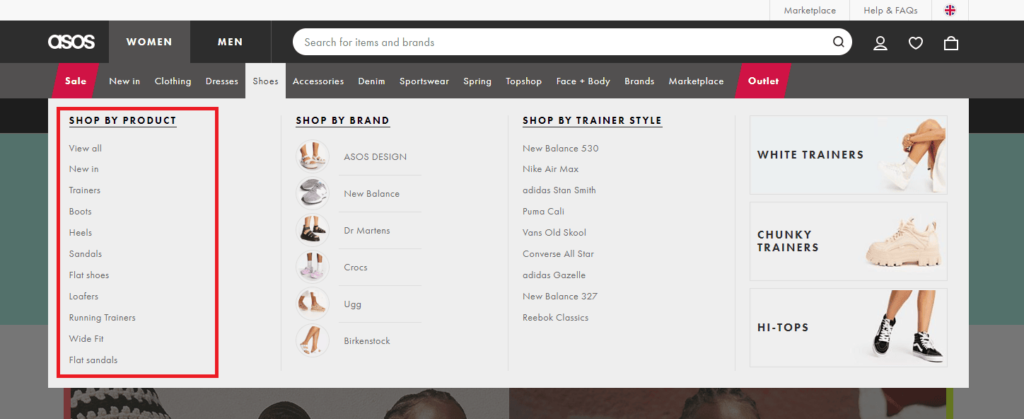
For this SQL query, let’s pretend that we’re a big ecommerce website, and we would like to analyze data for one of our product categories. So, we’ll pretend that we’re working for ASOS, a leading fashion ecommerce brand, and we want to know what women’s shoe type generates the best results from Google organic search. We’ll look at the top navigation menu of the ASOS website and select the product categories highlighted in the red box. Thankfully, the categories use a logical URL subdirectory structure that we can use for our filtering.
Because I don’t have access to ASOS data, I created a separate dummy database and added those subdirectories to my own website URLs. Weird, I know! But stay with me.
For our example below, we’ll create a table that includes the URL, total number of keywords, total clicks, total impressions, CTR, average position and category grouping based on the women’s shoe subdirectory structure.
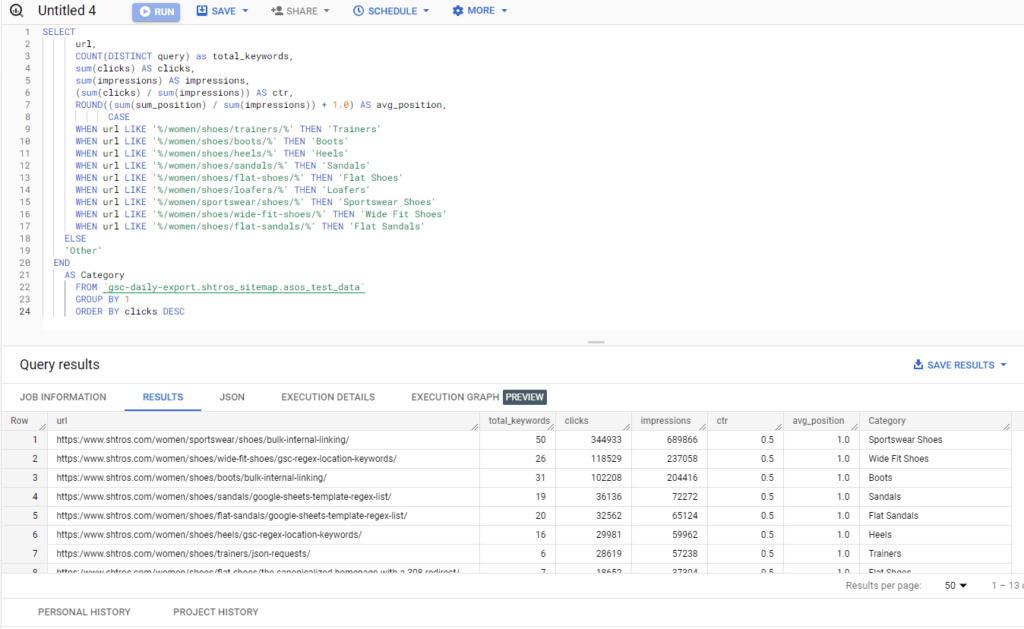
And here is the code for you to copy/paste:
SELECT
	  url,
	  COUNT(DISTINCT query) as total_keywords,
      sum(clicks) AS clicks,
	  sum(impressions) AS impressions,
	  (sum(clicks) / sum(impressions)) AS ctr,
	  ROUND((sum(sum_position) / sum(impressions)) + 1.0) AS avg_position,
      CASE
		  WHEN url LIKE '%/women/shoes/trainers/%' THEN 'Trainers'
		  WHEN url LIKE '%/women/shoes/boots/%' THEN 'Boots'
		  WHEN url LIKE '%/women/shoes/heels/%' THEN 'Heels'
		  WHEN url LIKE '%/women/shoes/sandals/%' THEN 'Sandals'
		  WHEN url LIKE '%/women/shoes/flat-shoes/%' THEN 'Flat Shoes'
		  WHEN url LIKE '%/women/shoes/loafers/%' THEN 'Loafers'
		  WHEN url LIKE '%/women/sportswear/shoes/%' THEN 'Sportswear Shoes'
		  WHEN url LIKE '%/women/shoes/wide-fit-shoes/%' THEN 'Wide Fit Shoes'
		  WHEN url LIKE '%/women/shoes/flat-sandals/%' THEN 'Flat Sandals'
    ELSE
    'Other'
	END
    AS Category
		  FROM `gsc-bulk-data-export.searchconsole.searchdata_url_impression`
		  GROUP BY url
      ORDER BY clicks DESC
We use a CASE WHEN statement to filter our URLs by the different shoe types. The results are similar to those in an Excel Pivot table. Of course, for your data, you want to ensure that you change the subdirectory URL references found in the WHEN statements according to your website’s structure.
Best performing subdirectory
Continuing with our ASOS example, we’ve previously added an extra column showing each URL’s category. But what if we wanted to know what is the best-performing women’s shoe category? For that, we’ll wrap our last query in a nested table and create an additional SQL query to provide us with the answer.
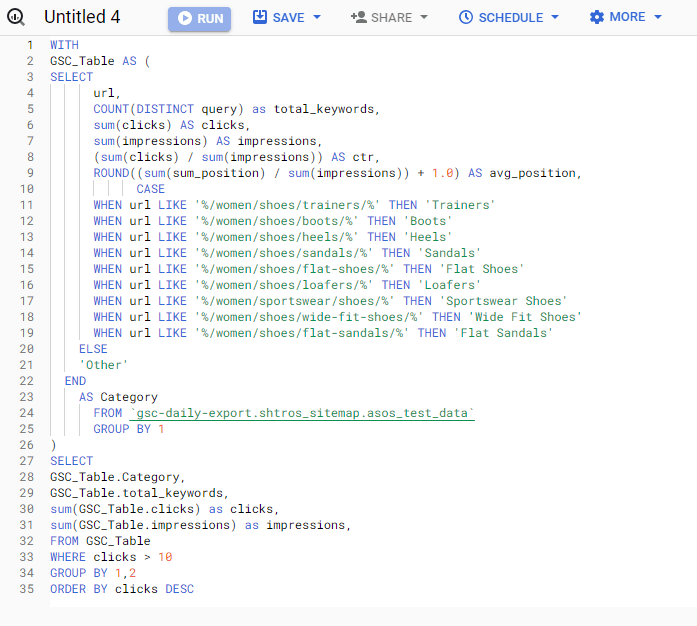
Here is the code for you to copy/paste:
WITH
GSC_Table AS (
SELECT
		  url,
		  COUNT(DISTINCT query) as total_keywords,
      sum(clicks) AS clicks,
		  sum(impressions) AS impressions,
		  (sum(clicks) / sum(impressions)) AS ctr,
		  ROUND((sum(sum_position) / sum(impressions)) + 1.0) AS avg_position,
            CASE
      WHEN url LIKE '%/women/shoes/trainers/%' THEN 'Trainers'
      WHEN url LIKE '%/women/shoes/boots/%' THEN 'Boots'
      WHEN url LIKE '%/women/shoes/heels/%' THEN 'Heels'
      WHEN url LIKE '%/women/shoes/sandals/%' THEN 'Sandals'
      WHEN url LIKE '%/women/shoes/flat-shoes/%' THEN 'Flat Shoes'
      WHEN url LIKE '%/women/shoes/loafers/%' THEN 'Loafers'
      WHEN url LIKE '%/women/sportswear/shoes/%' THEN 'Sportswear Shoes'
      WHEN url LIKE '%/women/shoes/wide-fit-shoes/%' THEN 'Wide Fit Shoes'
      WHEN url LIKE '%/women/shoes/flat-sandals/%' THEN 'Flat Sandals'
    ELSE
    'Other'
	END
    AS Category
		  FROM `gsc-bulk-data-export.searchconsole.searchdata_url_impression`
		  GROUP BY url
)
SELECT
GSC_Table.Category,
GSC_Table.total_keywords,
sum(GSC_Table.clicks) as clicks,
sum(GSC_Table.impressions) as impressions,
FROM GSC_Table
WHERE clicks > 10
GROUP BY GSC_Table.Category,GSC_Table.total_keywords,
ORDER BY clicks DESC
The SQL query above provides us with the following results:
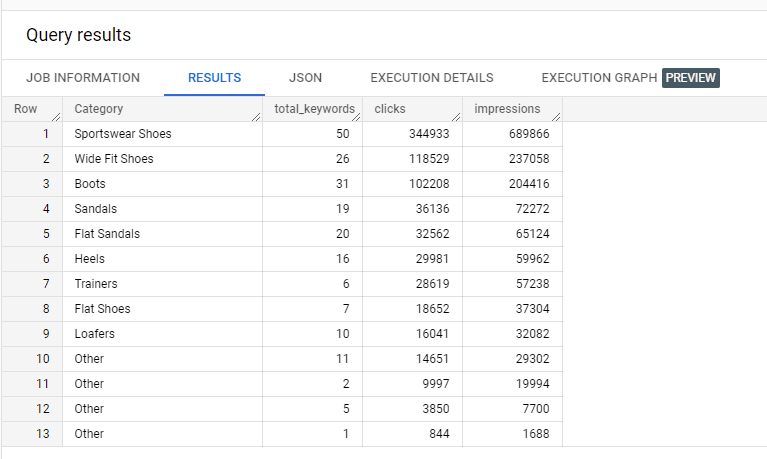
This is incredibly powerful! Now we can see how many keywords each category ranks for and the total number of clicks and impressions it gets from the Google search results.
Add position grouping
Using a similar methodology to what we did before to segment product categories of an ecommerce website, we can use the CASE WHEN statement to add an extra column to our table that shows the position grouping for each query.
The SQL query below allows us to create a table that shows the query, URL, position grouping, clicks and impressions:
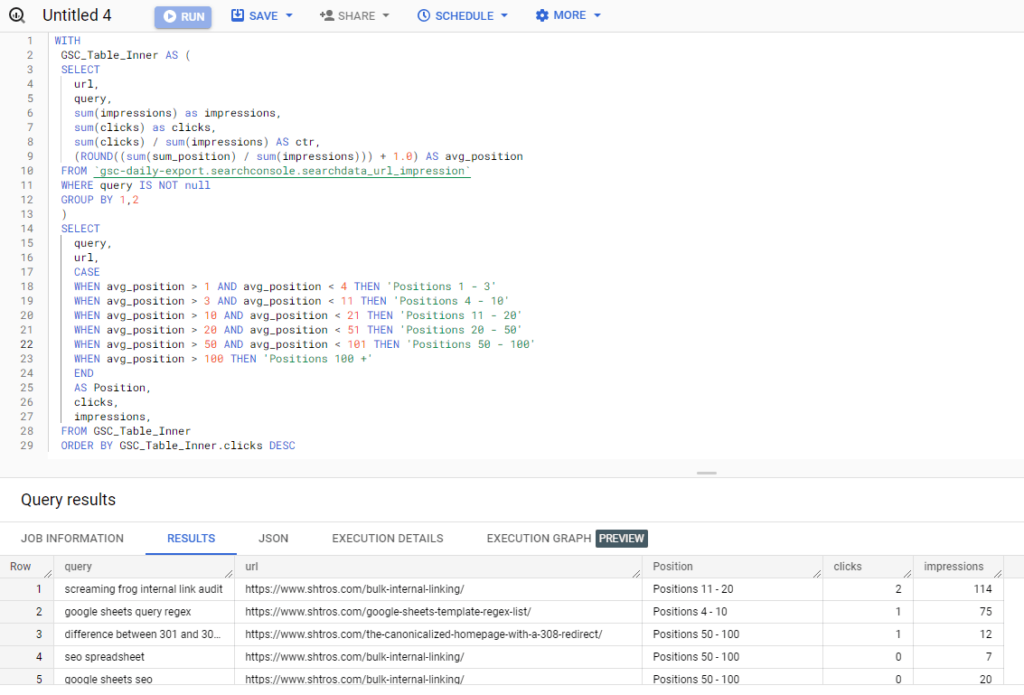
Here is the code for you to copy/paste:
  WITH
  GSC_Table_Inner AS (
  SELECT
    url,
    query,
    sum(impressions) as impressions,
    sum(clicks) as clicks,
    sum(clicks) / sum(impressions) AS ctr,
    (ROUND((sum(sum_position) / sum(impressions))) + 1.0) AS avg_position
  FROM `gsc-bulk-data-export.searchconsole.searchdata_url_impression`
  WHERE query IS NOT null
  GROUP BY url,query
  )
  SELECT
    query,
    url,
    CASE
    WHEN avg_position > 1 AND avg_position < 4 THEN 'Positions 1 - 3'
    WHEN avg_position > 3 AND avg_position < 11 THEN 'Positions 4 - 10'
    WHEN avg_position > 10 AND avg_position < 21 THEN 'Positions 11 - 20'
    WHEN avg_position > 20 AND avg_position < 51 THEN 'Positions 20 - 50'
    WHEN avg_position > 50 AND avg_position < 101 THEN 'Positions 50 - 100'
    WHEN avg_position > 100 THEN 'Positions 100 +'
    END
    AS Position,
    clicks,
    impressions,
  FROM GSC_Table_Inner
  ORDER BY GSC_Table_Inner.clicks DESC
Best performing position grouping
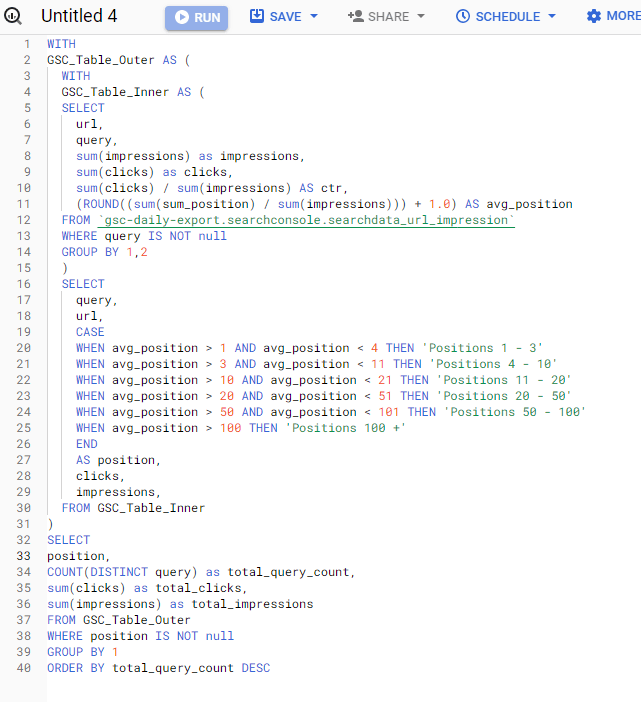
What if we used the position grouping from our last SQL query to determine the best-performing position grouping by the number of clicks or impressions? We can do that with BigQuery using the following SQL query:
WITH
GSC_Table_Outer AS (
  WITH
  GSC_Table_Inner AS (
  SELECT
    url,
    query,
    sum(impressions) as impressions,
    sum(clicks) as clicks,
    sum(clicks) / sum(impressions) AS ctr,
    (ROUND((sum(sum_position) / sum(impressions))) + 1.0) AS avg_position
  FROM `gsc-bulk-data-export.searchconsole.searchdata_url_impression`
  WHERE query IS NOT null
  GROUP BY url,query
  )
  SELECT
    query,
    url,
    CASE
    WHEN avg_position > 1 AND avg_position < 4 THEN 'Positions 1 - 3'
    WHEN avg_position > 3 AND avg_position < 11 THEN 'Positions 4 - 10'
    WHEN avg_position > 10 AND avg_position < 21 THEN 'Positions 11 - 20'
    WHEN avg_position > 20 AND avg_position < 51 THEN 'Positions 20 - 50'
    WHEN avg_position > 50 AND avg_position < 101 THEN 'Positions 50 - 100'
    WHEN avg_position > 100 THEN 'Positions 100 +'
    END
    AS position,
    clicks,
    impressions,
  FROM GSC_Table_Inner
)
SELECT
position,
COUNT(DISTINCT query) as total_query_count,
sum(clicks) as total_clicks,
sum(impressions) as total_impressions
FROM GSC_Table_Outer
WHERE position IS NOT null
GROUP BY position
ORDER BY total_query_count DESC
And the results look like this:
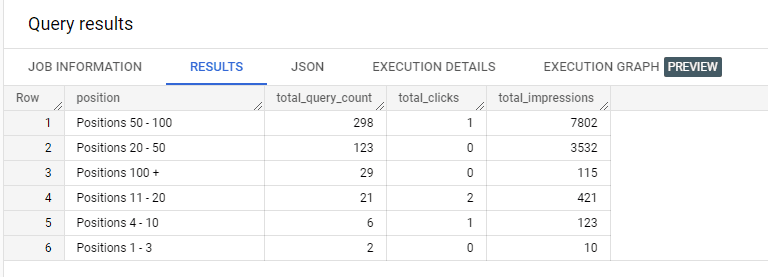
Using a couple of nested tables, we can get all queries by position grouping and see how well our website performs. From the example above, we can see that the queries in positions 50 – 100 account for the most considerable portion of total queries and generate the most impressions. Again, this data use my personal website analytics and gets very few clicks from Google!
Summary
As you can see from the example SQL queries above, you can use BigQuery with your Google Search Console data to get much better results! The examples above are only scratching the surface of what’s possible. And I’m not even talking about blending data from other sources, such as Google Analytics, sitemap, backlink data, etc.
There are limitless possibilities, so if you still need to try the bulk data connector, do so now! You can learn the basics of SQL quickly and have fun filtering through your website’s SEO data.
Disclaimer
I’m an SEO and not a SQL or BigQuery expert. As such, if you know of a more elegant way to write the SQL queries above, feel free to reach out! 🙂